US Housing Market Swings to Strongest Buyers Market on Record as Sellers Outnumber Purchasers by 71 Percent

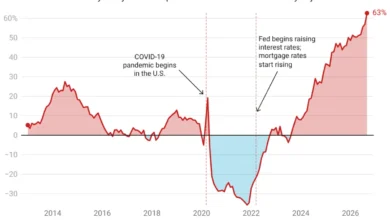
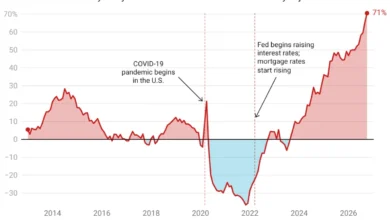
The United States real estate landscape is undergoing a profound structural shift, characterized by the strongest buyer’s market on record. Following years of intense, pandemic-fueled seller dominance that peaked in 2021, the national housing sector has flipped dramatically. Recent market data indicates that sellers now outnumber active buyers by a historic margin of nearly 71%. In numeric terms, the current marketplace features an estimated 1.53 million prospective sellers compared to just 896,000 buyers. Generally, a wider surplus of sellers translates into a more pronounced buyer’s market, endowing purchasers with unprecedented leverage in price negotiations, inspection contingencies, and closing cost concessions.
Despite this mathematical advantage for buyers, the broader macroeconomic environment complicates the reality on the ground. At the foundation of the current housing dynamic is a persistent, historic affordability crisis that makes day-to-day conditions feel markedly inhospitable to consumers. High mortgage rates, elevated construction costs, and broad economic uncertainty have forced many potential purchasers to remain on the sidelines. Consequently, only those with robust financial profiles or urgent relocation needs are actively buying, allowing them to dictate terms. Meanwhile, sellers are trickling back into the market in waves, either adjusting to the new normal of lower demand or reacting out of concern that home values could deteriorate further if they delay their listings. This influx of inventory further exacerbates the supply-demand imbalance.
Understanding the Mechanics of Real Estate Markets
To contextualize the current landscape, real estate analysts distinguish sharply between buyer’s and seller’s markets. A buyer’s market typically materializes when housing inventory significantly outstrips buyer demand. Under these conditions, purchasers encounter less competition, face fewer or non-existent bidding wars, and frequently secure seller concessions such as price reductions or repair credits. Appreciation rates for home prices generally decelerate during these periods. However, if a buyer’s market drives prices down sufficiently, the market equilibrium often corrects itself as sidelined buyers re-enter the fold, ultimately reheating demand and pushing prices upward once more.
Conversely, a seller’s market occurs when housing demand heavily outpaces available supply. In this scenario, active buyers significantly outnumber sellers, creating intense competition and frequent bidding wars. Sellers maintain absolute control over negotiations, routinely commanding sales prices at or above asking figures, while properties transition from listing to closing at accelerated speeds. Historical tracking demonstrates that the years immediately following the onset of the global pandemic adhered strictly to this seller-dominated model, pricing out millions of everyday Americans.
Chronology of a Market Reversal: From Pandemic Boom to 2026 Correction
The trajectory leading to the current market inversion began during the historic disruptions of 2020 and 2021. Sparked by historic lows in interest rates and a cultural shift toward remote work, millions of Americans relocated to more affordable regions, particularly across the American Sun Belt. Cities like Austin, Phoenix, and various Florida metropolitan areas transformed into overnight "zoomtowns," experiencing astronomical population growth and rapid home price appreciation.
By 2022, however, the Federal Reserve began aggressively hiking interest rates to combat soaring inflation. This monetary policy shift caused mortgage rates to double in a remarkably short span, abruptly halting the pandemic housing frenzy. As borrowing costs climbed, buyer demand cooled significantly. Yet, homebuilders, responding to the prior years of high demand, continued aggressive residential construction projects throughout 2023, 2024, and 2025. This wave of new construction eventually collided with a depleted buyer pool, culminating in record inventory levels by late 2025 and 2026. By October 2026, the cumulative effect of high interest rates, overbuilding, and consumer fatigue produced the current record-shattering surplus of sellers.
Geographic Divergence: The Sun Belt Glut Versus Northeastern Resilience
The national trend toward a buyer’s market is not distributed evenly across the United States. Regional disparities remain stark, driven by local economic conditions, population shifts, and historical inventory constraints.
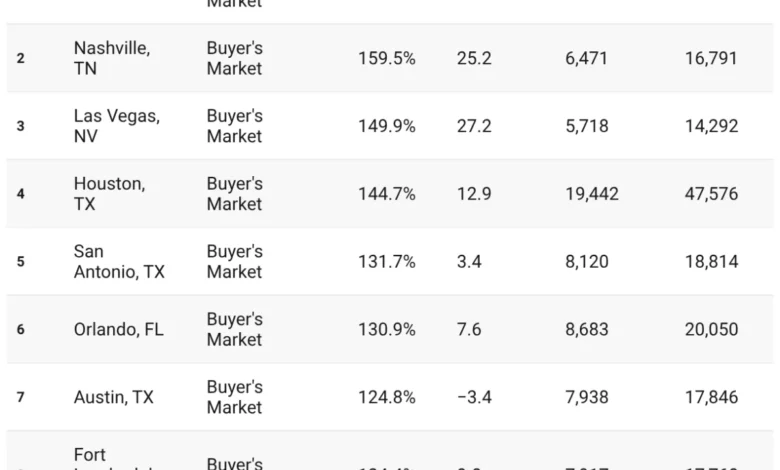
In total, 41 out of the 50 largest U.S. metropolitan areas currently qualify as buyer’s markets, defined by Redfin data as regions where sellers outnumber buyers by at least 10%. The Sun Belt region—stretching from the Southeast through the Southwest—hosts the nation’s most pronounced buyer’s markets. Miami leads the country in seller surplus, while Austin, Texas, serves as ground zero for the post-pandemic correction that has impacted former boomtowns. During the pandemic, Florida and Texas experienced unprecedented surges in residential construction to meet incoming migration. Today, however, many of those newly constructed homes sit vacant or unsold as local demand wilts under the weight of surging property insurance costs, heightened climate risks, and elevated price points. Florida specifically recorded its highest level of housing inventory on record in late 2025, driven largely by skyrocketing property insurance premiums tied to severe weather events.
In sharp contrast, the Northeast remains the primary stronghold for seller’s markets. Only five major U.S. metropolitan areas currently favor sellers by the same 10% metric, and all of them are located in the Northeast. Historically, housing construction and population growth in this region have lagged behind the Sun Belt. Consequently, with buyers searching frantically for affordable housing options, regional supply falls drastically short of demand, preserving seller leverage and driving competitive pricing dynamics.
San Francisco presents a unique hybrid case within this landscape. Long categorized as an unyielding seller’s market, San Francisco recently absorbed a massive wave of housing demand fueled by an influx of artificial intelligence sector wealth. While this trend has moderated slightly due to broader economic jitters, San Francisco remains the most expensive metropolitan area in the nation and continues to display mild seller-market characteristics.
Shifting Balances in Major Metros
Beyond the extremes of the Sun Belt and the Northeast, the balance of power is actively shifting in major regional hubs across the country. Coastal markets such as Boston, San Jose, and Seattle are rapidly transitioning into robust buyer’s markets. Sellers in these high-cost areas are increasingly struggling to attract cost-wary consumers. Seattle, in particular, has cooled faster than most comparable tech-centric cities, weighed down by localized tech sector workforce adjustments and a softening economic outlook.
Conversely, regions like West Palm Beach and Detroit are slowly pivoting toward seller-friendly dynamics, although buyers retain the upper hand for now. Even as overall buyer volume contracts in these areas, the inventory deficit is so profound that the structural balance slowly drifts toward sellers.
Expert Analysis and Macroeconomic Pressures
The broader economic environment continues to introduce volatility into the housing sector. Policymakers, economists, and real estate leaders point to an interlocking web of financial pressures influencing consumer behavior. Persistent inflation, shifting monetary policies by the Federal Reserve, escalating geopolitical tensions in the Middle East, new trade tariffs, and evolving federal housing and immigration policies have collectively dampened consumer confidence. Furthermore, residential construction has grown increasingly expensive due to rising material and labor costs, placing additional strain on an aging national housing stock.
"Many Americans are facing a historically challenging economy, with financial pressures mounting on multiple fronts that are weighing on consumer confidence and keeping most buyers on the bench," said Chen Zhao, Head of Economics Research at Redfin. "Even so, there are some bright spots. In part because housing costs are so high and so few homes are selling, prices recently nationally fell for the first time since 2023. The prolonged seller’s market is over, so buyers with the budget may want to act now while competition is lower and sellers are more willing to negotiate."
While economists acknowledge that the path forward will involve short-term market adjustments and volatility, forward-looking projections from Redfin and other financial institutions suggest that housing affordability will steadily improve over the coming years as inventory absorbs and pricing expectations recalibrate.
Navigating the Current Housing Market
For prospective buyers and sellers attempting to navigate these shifting dynamics, real estate experts emphasize that national headlines often obscure hyper-local realities. Housing trends can vary dramatically not just from city to city, but across adjacent neighborhoods within the same municipality.
To accurately assess whether a specific local market favors buyers or sellers, market participants utilize several key diagnostic strategies:
- Tracking Real Estate Data Dashboards: Public resources, such as the Redfin Data Center, publish monthly metrics tracking buyer and seller dynamics across the 50 largest U.S. metropolitan areas. These dashboards provide a reliable baseline for national and regional trend analysis.
- Analyzing Months of Supply: A standard industry metric for market health is "months of supply"—the duration required to exhaust current inventory at the existing sales pace. Generally, a supply level below four months signals a seller’s market, while inventory exceeding five to six months indicates a buyer’s market.
- Monitoring Sale Price Trends: Accelerating price growth typically accompanies seller-dominated markets, whereas buyer’s markets are characterized by cooling appreciation rates, flat pricing, or outright price contractions.
- Evaluating Mortgage Rate Fluctuations: Interest rates heavily dictate purchasing power. Higher rates typically depress buyer demand, forcing sellers to make concessions and empowering active purchasers.
- Consulting Local Real Estate Professionals: Because real estate is fundamentally local, experienced agents retain the most accurate, real-time insights regarding days on market, price-drop frequencies, and neighborhood-specific bidding activity.
Methodological Notes
Data concerning inventory distributions, buyer-to-seller ratios, and regional pricing trends reflect figures compiled through October 2026. Unless otherwise noted, metrics are seasonally adjusted and historical comparisons date back to 2013. Comprehensive breakdowns of methodology and metro-level statistical reports remain accessible via public real estate data repositories.