
Mastering AI Enablement: A Strategic Framework for Career Advancement and Organizational Integration in the Operational Era
The global professional landscape has entered what economists and technology analysts describe as the "operational era" of artificial intelligence. This phase marks a significant transition from the experimental ad-hoc prompting of 2023 and 2024 toward a period of sustained, integrated utilization within core business functions. As organizations move beyond the initial novelty of generative AI, a distinct performance gap has emerged between professionals who merely possess an awareness of AI tools and those who are "AI-enabled"—individuals who have successfully embedded these technologies into their daily workflows to drive measurable output.
According to recent industry data from HubSpot and Jasper AI, the expectation for increased productivity is no longer theoretical. In the 2026 State of Marketing report, 83% of marketing professionals indicated they are now expected to produce more content and higher-quality strategic work than in previous years, specifically because of the perceived efficiencies granted by AI. This shift suggests that AI proficiency is rapidly transitioning from a competitive differentiator to a baseline requirement, much like the adoption of spreadsheet software in the late 20th century.
The Performance Gap and the Operational Era of AI
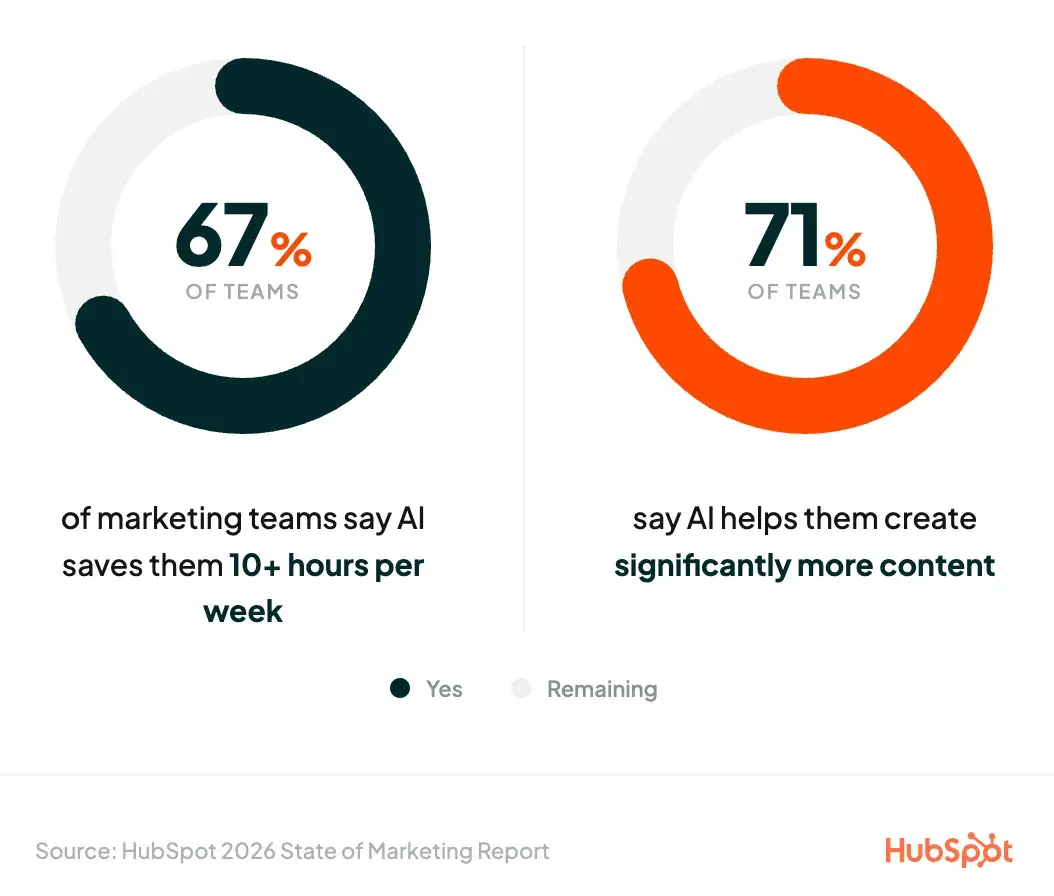
In the current labor market, the value of manual execution for routine tasks is depreciating. AI-enabled professionals are increasingly leveraging technology as a force multiplier, allowing small, strategically focused teams to achieve the output previously reserved for much larger departments. Data indicates that 67% of marketing teams report saving 10 or more hours per week through AI integration, while 71% claim the technology allows them to create significantly more content without increasing headcount.

This transition into the operational era signifies that the window for early-adoption advantage is narrowing. Industry experts suggest that while managers are noticing those who use AI to cut process times in half today, such achievements will likely be considered standard operating procedure within the next 24 months. Consequently, the professional advantage is shifting toward those who can demonstrate a higher-order application of AI—using it not just for speed, but for strategic problem-solving and cross-functional leadership.
Chronology of Artificial Intelligence Adoption in the Workplace
The trajectory of AI integration in the corporate sector can be categorized into four distinct phases:
- The Experimental Phase (2022–2023): Characterized by the public release of Large Language Models (LLMs) like ChatGPT and Claude. Usage was primarily individual, uncoordinated, and focused on novelty or simple text generation.
- The Policy and Governance Phase (2024): Organizations began implementing formal AI usage policies, addressing data privacy concerns, and vetting enterprise-grade tools.
- The Operational Era (2025–Present): Companies are now focusing on "enablement"—the process of moving employees from awareness to adoption. This phase emphasizes workflow redesign and the creation of custom internal AI agents.
- The Native Integration Era (Forecasted 2027+): AI is expected to be invisible and ubiquitous, embedded natively into every software interface, where "using AI" is no longer a conscious choice but a standard feature of digital labor.
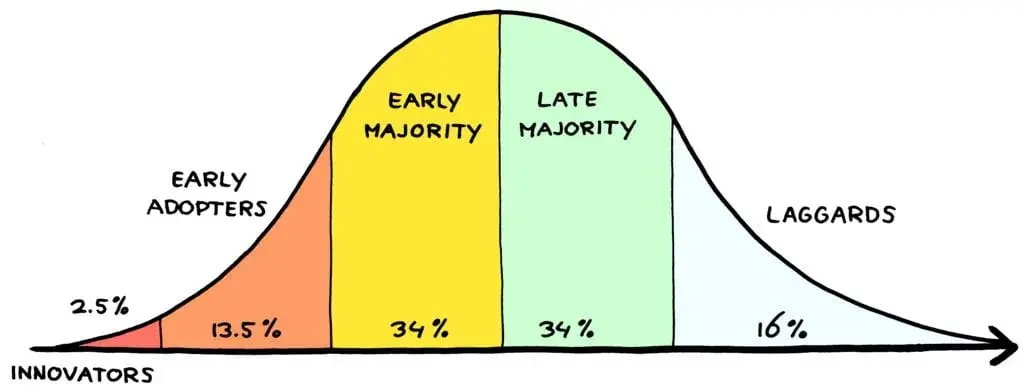
Currently, the market sits in the "Early Majority" stage of the Diffusion of Innovation theory, a framework originally proposed by E.M. Rogers. While innovators and early adopters have dominated the conversation for several years, the bulk of the global workforce is only now beginning to standardize AI usage.
Analyzing the Knowing-Doing Gap in AI Adoption
Despite the high levels of motivation among workers to learn AI, a significant "knowing-doing gap" persists. Research from the Boston Consulting Group (BCG) highlights that 74% of companies have yet to realize tangible business value from their AI investments. The study suggests that 70% of implementation failures are rooted in human and process-related issues, rather than technical limitations or algorithmic deficiencies.

Timothy Biondollo, a prominent AI specialist at HubSpot Media, notes that the transition to being AI-enabled requires a fundamental shift in operating models. "Awareness is passive," Biondollo states. "Adoption requires you to change how you actually work. Enabled people spend their time gathering context and writing instructions, running parallel workstreams in the background while they focus on strategy and quality."
This psychological barrier is compounded by the "productivity trap," where improper AI use can actually create more work. Professionals often report that poorly prompted AI outputs require extensive fact-checking, reformatting, and editing, which can negate the time saved during the generation phase. Avoiding this trap requires a shift in methodology from simple prompting to sophisticated "WRITE" frameworks.
Technical Frameworks: The WRITE Prompting Method
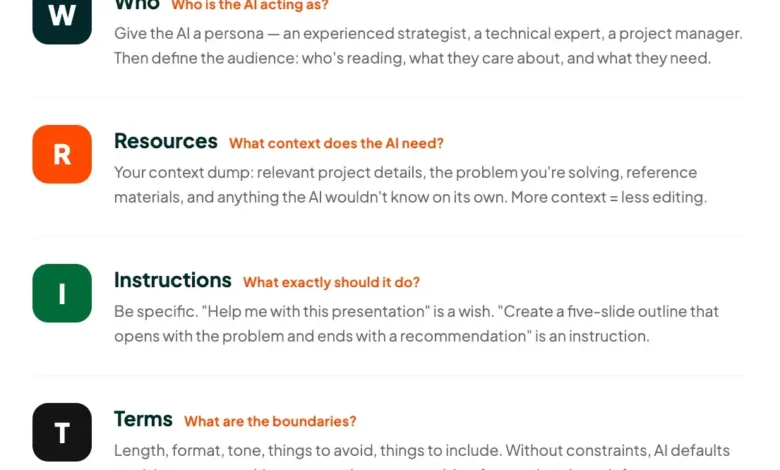
To bridge the gap between subpar results and high-impact output, experts have developed the WRITE framework, a five-pillar approach to AI communication designed to provide the necessary context for complex tasks:
- W (Who): Defining the persona. The user must specify the expertise level and professional background the AI should emulate (e.g., a DTC marketing consultant).
- R (Resources): Providing context. This involves feeding the AI specific data points, budget constraints, and previous success metrics to ground the response in reality.
- I (Instructions): Defining the task. Clear, step-by-step requirements for what the AI needs to build, such as a four-week launch plan.
- T (Terms): Setting boundaries. Establishing constraints, such as tone of voice, "no-go" zones (e.g., no paid ads), and operational limitations.
- E (Expected Outcome): Deliverables. Specifying the exact format of the output, such as a week-by-week calendar or a checklist.
Data suggests that using structured frameworks like WRITE significantly reduces the need for "re-prompting," thereby increasing the net efficiency of the tool.
Managerial Impact and Organizational Endorsement
The role of leadership in AI adoption cannot be overstated. Research conducted by Irrational Labs found that employee AI usage drops from 79% to 34% in environments where managers do not explicitly endorse or encourage the technology. This 45-percentage-point difference highlights a critical dependency: workers are often hesitant to use AI if they fear it will be viewed as "cutting corners" or if they lack a clear mandate to experiment.
Furthermore, 2026 Gallup data reveals a disparity in usage rates across organizational hierarchies. Approximately 69% of senior leaders and 55% of managers report using AI at least a few times a year, compared to only 40% of individual contributors. This suggests that while leadership is experimenting with AI for high-level strategy, the integration into daily execution tasks remains a challenge for the broader workforce.
To combat this, organizations are encouraged to make AI progress visible. Experts recommend that employees maintain an "AI goals schedule" and provide regular updates to management regarding efficiency gains. This visibility not only secures the employee’s role as an "internal expert" but also provides the data leadership needs to justify further investment in AI infrastructure.
Strategic Industry Moves: The Acquisition of Futurepedia
In a move that signals the growing importance of AI education over simple software provision, HubSpot recently announced the acquisition of Futurepedia. As the world’s largest independent AI education and discovery platform, Futurepedia maintains a directory of thousands of curated tools and offers more than 1,000 lessons focused on practical AI skills for business.
The acquisition reflects a broader market trend where software-as-a-service (SaaS) providers are recognizing that tools alone are insufficient. The "enablement" piece—teaching users how to actually derive value from the software—is becoming the primary battleground. Futurepedia’s integration into the HubSpot ecosystem is intended to provide a standardized starting point for professionals to move from theoretical knowledge to practical, career-advancing application.
Broader Impact and Future Implications
The long-term implications of AI enablement suggest a permanent restructuring of the professional ladder. As AI proficiency becomes the new baseline, the "laggards" (those who fail to adopt the technology) face increasing risks of obsolescence. Conversely, those who master the "parallel workstream" model—managing multiple AI-driven tasks simultaneously—will likely see a faster trajectory toward leadership roles.
In conclusion, the transition to an AI-enabled workforce is less about the technology itself and more about the human ability to adapt to a new era of "augmented labor." By focusing on structured prompting, consistent experimentation, and visible progress, professionals can navigate the operational era of AI to enhance both their organizational impact and their long-term career resilience. The focus for the remainder of 2026 and into 2027 will remain on "execution over experimentation," as the business world seeks to finally close the gap between the promise of AI and its practical, daily utility.
