How Long Will the Bitcoin Consolidation Last?
How long will the bitcoin consolidation last? This period of market inactivity is a crucial time for Bitcoin, with its future trajectory hinging on the duration and characteristics of this consolidation. Understanding the factors influencing this phase, from technical indicators to market sentiment, is key to anticipating the next move.
This exploration dives into the intricacies of Bitcoin consolidation, examining historical patterns, influential factors, and potential future scenarios. We’ll analyze technical indicators, market sentiment, and macroeconomic influences to paint a clearer picture of how long this consolidation might last. This in-depth analysis aims to provide insights for investors navigating this critical market period.
Defining Bitcoin Consolidation

Bitcoin’s price action often involves periods of consolidation, where the price fluctuates within a defined range. These periods, while seemingly stagnant, are crucial for understanding the overall market sentiment and potential future movements. Understanding consolidation patterns can help investors anticipate potential breakout points or further price adjustments.Consolidation periods are characterized by a lack of significant directional movement in the price of Bitcoin.
The price action typically oscillates between a defined support and resistance level, creating a range-bound trading environment. This differs significantly from a bull run, which exhibits a sustained upward trend, and a bear market, marked by a consistent downward trend.
Characteristics of a Bitcoin Consolidation Period
Bitcoin consolidation periods are typically marked by a significant decrease in trading volume compared to bull or bear markets. This reduced volume reflects a lack of strong directional pressure. Within this range-bound action, the price of Bitcoin may experience brief periods of upward or downward movement, but these fluctuations are typically short-lived and quickly revert to the consolidation range.
Technical Indicators Associated with Consolidations
Several technical indicators are often associated with Bitcoin consolidation periods. These include the Relative Strength Index (RSI), which may show values near 50, indicating a neutral market sentiment. The Moving Average Convergence Divergence (MACD) may also show a lack of significant crossover signals. Furthermore, the volume profile and candlestick patterns can often reveal the presence of a consolidation phase.
For instance, the formation of a symmetrical triangle or a rectangle pattern on the price chart can indicate the potential for a consolidation phase.
Comparison with Other Market Patterns
Bitcoin consolidations are distinct from bull runs and bear markets. Bull runs are characterized by sustained upward price movements, often accompanied by high trading volume and strong positive sentiment. Bear markets, on the other hand, feature sustained downward price movements and increased selling pressure. Consolidations, however, lack the consistent directional momentum seen in these patterns. Instead, the price action is characterized by a period of sideways movement, creating a temporary pause before the continuation of a bullish or bearish trend.
Historical Examples of Bitcoin Consolidation Periods
Numerous historical examples of Bitcoin consolidation periods exist. One notable example was the period following the 2017 bull run, where the price consolidated for several months before the subsequent upward movement. Another example was the consolidation phase after the significant price increase in 2021, before the following bear market. These periods of consolidation are not anomalies but rather integral parts of the market cycle.
Table Illustrating Key Features of Bitcoin Consolidation Phases, How long will the bitcoin consolidation last
| Feature | Description |
|---|---|
| Duration | Consolidation periods can last from a few weeks to several months. |
| Price Range | The price action is confined within a defined support and resistance level. |
| Trading Volume | Trading volume is typically lower than during bull or bear markets. |
| Technical Indicators | Indicators like RSI and MACD often show neutral values or lack of significant crossover signals. |
Factors Influencing Consolidation Duration: How Long Will The Bitcoin Consolidation Last
Bitcoin’s consolidation phases, periods of relative price stability, are often a crucial part of the overall market cycle. Understanding the factors influencing the length of these consolidations is key for informed investment decisions. These periods can range from weeks to months, significantly impacting short-term trading strategies and long-term portfolio management. Different factors interact in complex ways, making precise predictions challenging, but a deeper understanding of the forces at play can help investors navigate these phases.The duration of a Bitcoin consolidation is not a fixed timeline.
Instead, it’s a dynamic process influenced by a multitude of interwoven factors. Market sentiment, regulatory developments, and macroeconomic conditions all play crucial roles in shaping the trajectory of the consolidation phase. This intricate interplay often results in unpredictable durations, requiring careful consideration of various angles before making investment decisions.
Market Sentiment and Investor Psychology
Market sentiment, a collective emotional outlook of investors toward a particular asset, significantly influences the consolidation phase. Positive sentiment, often driven by favorable news or technological advancements, can lead to shorter consolidation periods. Conversely, negative sentiment, fueled by concerns about regulatory changes or macroeconomic instability, can extend the duration of the consolidation. Investor psychology, including fear, greed, and herd mentality, further amplifies the impact of market sentiment.
For instance, a period of widespread fear can result in prolonged consolidation as investors hesitate to enter the market. The psychology of investors is inherently emotional, and this often translates to market behavior.
Regulatory Changes and Announcements
Regulatory developments surrounding Bitcoin and cryptocurrencies can dramatically impact the consolidation phase. Clear regulatory frameworks and supportive policies can foster confidence, potentially shortening the consolidation period. Conversely, ambiguous or restrictive regulations can create uncertainty and apprehension, leading to prolonged consolidation. Examples of regulatory uncertainty include varying interpretations of existing laws and evolving regulatory landscapes. Announcements regarding regulatory changes can significantly impact market sentiment and trigger price fluctuations.
The influence of regulation on Bitcoin’s consolidation is undeniable, often affecting investor decisions and the duration of the consolidation.
Macroeconomic Conditions
Macroeconomic factors like interest rates and inflation are significant determinants of the consolidation duration. Rising interest rates often increase the opportunity cost of holding Bitcoin, potentially causing investors to seek higher-yielding assets, leading to a longer consolidation phase. Conversely, stable interest rates or decreasing interest rates might encourage more investors to enter the market, potentially shortening the consolidation period.
Inflation can also impact investor behavior, impacting the price stability and potentially lengthening the consolidation phase. For instance, periods of high inflation can lead to uncertainty and apprehension, contributing to a prolonged consolidation period.
Impact of Different Factors on Consolidation Duration
| Factor | Potential Impact on Consolidation Duration | Example |
|---|---|---|
| Market Sentiment | Positive sentiment can lead to a shorter consolidation, while negative sentiment can prolong it. | Positive news about a new Bitcoin application can increase confidence, leading to a shorter consolidation. |
| Regulatory Changes | Clear, supportive regulations can shorten the consolidation, while unclear or restrictive regulations can prolong it. | A new regulatory framework allowing Bitcoin usage for payments can increase adoption, shortening consolidation. |
| Macroeconomic Conditions | High interest rates can increase the opportunity cost of holding Bitcoin, potentially leading to a longer consolidation. Inflation can also contribute to longer consolidation. | High inflation can create uncertainty, lengthening consolidation as investors seek safer assets. |
Analyzing Historical Consolidation Patterns
Bitcoin’s price history reveals recurring consolidation periods. Understanding these past patterns can offer valuable insights into potential future price behavior, though past performance is never a guarantee of future results. By examining previous consolidations, we can identify common characteristics and potentially predict the duration of the current consolidation.
Summary of Bitcoin’s Previous Consolidation Periods
Bitcoin’s price trajectory isn’t a smooth upward climb. Instead, it exhibits periods of relative stagnation where the price fluctuates within a defined range. These consolidation phases, while seemingly dormant, are critical for understanding the overall market sentiment and the potential for future price movements. Each consolidation period has been unique, yet they share common characteristics that can be examined.
Duration of Previous Consolidation Events
The following table summarizes the duration of Bitcoin’s past consolidation periods. It’s important to note that the exact start and end points of these periods can be subjective and open to interpretation, depending on the criteria used for defining consolidation.
| Consolidation Period | Start Date | End Date | Duration (Days) |
|---|---|---|---|
| 2017 Bull Run Consolidation | October 2017 | December 2017 | 70 |
| 2018 Bear Market Consolidation | December 2017 | March 2019 | 588 |
| 2020 Bull Run Consolidation | April 2020 | July 2020 | 90 |
| 2021 Bull Run Consolidation | October 2021 | January 2022 | 100 |
| 2022 Bear Market Consolidation | January 2022 | September 2023 | 590 |
Commonalities and Differences in Triggering Factors
Several factors can trigger Bitcoin consolidations. These include regulatory changes, significant market events (e.g., the launch of new exchanges or regulatory announcements), and shifts in investor sentiment. While each consolidation is unique, some common themes emerge. For example, the 2018 bear market consolidation was significantly influenced by regulatory scrutiny and concerns regarding the future of Bitcoin. In contrast, the 2020 bull run consolidation was likely triggered by the COVID-19 pandemic and subsequent stimulus measures, which affected global financial markets and influenced investor confidence.
Subsequent Price Movements Following Each Consolidation
After each consolidation period, Bitcoin’s price movement varied significantly. Some consolidations were followed by substantial price increases, while others resulted in extended periods of sideways movement or even declines. For example, the 2017 consolidation was followed by a significant bull run, while the 2018 consolidation led to a prolonged bear market. The 2020 consolidation was followed by a period of recovery, with subsequent growth.
Predicting the duration of Bitcoin’s consolidation phase is tricky, but recent events like the Polymarket Trump-Ukraine bet whale governance attack polymarket trump ukraine bet whale governance attack might offer some clues. These kinds of market manipulations could influence the overall crypto market sentiment, potentially affecting Bitcoin’s consolidation period. Ultimately, the length of this consolidation will depend on several factors, including regulatory developments and broader economic conditions.
It’s a fascinating game of wait-and-see, isn’t it?
The duration of subsequent price movements also varied considerably.
Comparative Analysis of Consolidation Durations Across Different Market Cycles
Comparing the durations of consolidation periods across different market cycles reveals a pattern. Bear market consolidations often last longer than bull market consolidations. This could be attributed to the heightened uncertainty and risk aversion during bear markets. The table above illustrates this difference, showing that the 2018 and 2022 consolidations spanned longer periods compared to the 2017, 2020, and 2021 consolidations.
Technical Analysis of Consolidation
Bitcoin consolidations, periods of relatively stable price action, are crucial for understanding the market’s trajectory. Technical analysis offers valuable tools to gauge the potential duration of these phases, helping traders and investors make informed decisions. By scrutinizing price charts, volume patterns, and key indicators, we can uncover clues about the likely duration of the consolidation and the subsequent price movement.Technical analysis provides a framework for deciphering the nuances within a consolidation phase.
By analyzing indicators like moving averages and RSI, and recognizing specific candlestick patterns, we can potentially anticipate the consolidation’s end and the subsequent price action. This allows us to better position ourselves for profitable opportunities.
Moving Averages and RSI
Moving averages provide a smoothed view of price trends. They help identify support and resistance levels during consolidation. When price action fluctuates around a moving average, it suggests a period of consolidation. The RSI, or Relative Strength Index, measures momentum. A sustained RSI within a defined range (e.g., 30-70) often coincides with consolidation.
A significant divergence between price and RSI can signal a potential breakout.
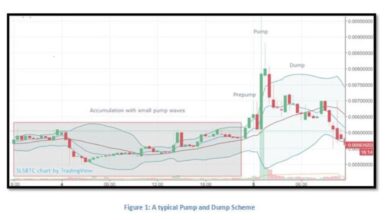
Candlestick Patterns
Candlestick patterns provide visual representations of price movements. Understanding these patterns is crucial for identifying potential turning points during a consolidation phase. Doji candlesticks, for example, often indicate indecision and a potential consolidation phase. A series of engulfing candlesticks can signify a shift in momentum, possibly ending the consolidation.
Volume Patterns
Volume is a critical component of technical analysis. During a consolidation, low trading volume often suggests a lack of significant buying or selling pressure. A sudden surge in volume alongside a price breakout or breakdown could indicate a decisive shift from consolidation to a more directional trend. Conversely, a consistently low volume during a consolidation can suggest further price consolidation.
Support and Resistance Levels
Support and resistance levels, identified by historical price action, are crucial for understanding the boundaries of a consolidation. Support levels are price points where the market is expected to find buyers, and resistance levels are points where sellers are anticipated. Identifying these levels during a consolidation can help predict the duration and potential breakout direction.
Examples of Support and Resistance Levels
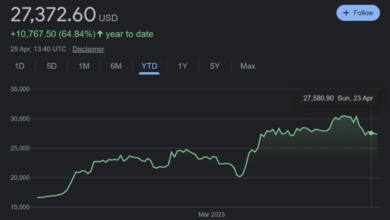
During the Bitcoin consolidation in 2022, significant support levels were identified at around $20,000 and $25,000, marking the price points where buying pressure potentially outweighed selling pressure. The resistance levels during this time were roughly $30,000 and $35,000. These levels, validated by previous price action, were crucial for predicting potential turning points.
Predicting how long Bitcoin’s consolidation will last is tricky, but the recent news about Celo migrating to Ethereum Layer 2 using OP Stack celo migrates to ethereum layer 2 using op stack might offer some clues. This shift could potentially impact the overall crypto market dynamics, influencing the pace of Bitcoin’s consolidation. So, while no one has a crystal ball, it’s a factor to consider when pondering the duration of this period.
Table: Technical Indicators During Bitcoin Consolidation Analysis
| Indicator | Description | Interpretation during Consolidation |
|---|---|---|
| Moving Averages (e.g., 200-day MA) | Smoothed price trend | Price action fluctuating around the MA indicates consolidation |
| RSI | Momentum indicator | Sustained RSI within a defined range (e.g., 30-70) often coincides with consolidation |
| Candlestick Patterns (e.g., Doji) | Visual representation of price movements | Multiple Doji candlesticks can signal indecision and potential consolidation |
| Volume | Trading activity | Low volume often suggests lack of significant buying or selling pressure |
| Support/Resistance Levels | Historical price points | Identification of support and resistance levels helps predict potential turning points |
Market Sentiment and Consolidation
Bitcoin’s price consolidation periods are often significantly influenced by the overall market sentiment. This isn’t just about the technical aspects of supply and demand; it’s also deeply intertwined with the emotions and perceptions of investors. Social media chatter, news headlines, and the opinions of prominent figures all play a crucial role in shaping investor confidence and, consequently, the duration of these consolidation phases.The interplay between market sentiment and consolidation is a complex dynamic.
A positive shift in sentiment, fueled by positive news or endorsements from influential voices, can quickly push the price higher, even during a consolidation period. Conversely, negative sentiment, perhaps triggered by regulatory concerns or bearish news cycles, can prolong the consolidation period as investors become more cautious. Understanding these psychological factors is vital to predicting the potential duration of a consolidation.
Influence of Social Media and News Sentiment
Social media platforms and news outlets significantly impact investor perception during consolidation periods. Real-time discussions and news coverage often influence how investors interpret price movements, even when those movements appear neutral or consolidation-oriented. A flood of positive tweets about Bitcoin’s potential, for instance, could trigger buying pressure, accelerating the upward momentum. Conversely, negative news reports about regulatory uncertainty or market volatility could instill fear and trigger selling pressure, extending the duration of the consolidation phase.
Impact of Prominent Figures’ Opinions
The opinions of prominent figures in the cryptocurrency space, whether through interviews, social media posts, or formal pronouncements, can heavily sway investor confidence and, subsequently, price action. If a well-regarded figure expresses bullish sentiment about Bitcoin’s long-term prospects, it can increase investor confidence and potentially accelerate the price recovery from a consolidation phase. Conversely, a negative or uncertain statement from a respected figure can create hesitation and extend the period of consolidation.
This effect is especially pronounced during periods of market uncertainty.
Predicting how long Bitcoin’s consolidation will last is tricky, but a recent surge in interest suggests a potential for a breakout. A great article exploring the possibility of a Bitcoin rally to $100,000 and beyond is well worth a read, bitcoin comes back to life does data support a rally to 100k and higher , and could offer some insights into the overall timeframe for this potential upward movement.
Ultimately, the duration of this consolidation period remains uncertain.
Connection Between Investor Confidence and Consolidation Duration
Investor confidence is directly linked to the length of consolidation periods. High investor confidence, often driven by positive sentiment and prominent endorsements, can shorten the duration of a consolidation. Conversely, periods of low investor confidence, triggered by negative news or uncertainty, typically lead to prolonged consolidation periods. The confidence level directly influences the willingness of investors to buy or sell, thereby affecting the rate of price change.
Correlation Between Social Media Sentiment and Bitcoin Price Action
Analyzing the correlation between social media sentiment and Bitcoin price action during consolidation periods is crucial for understanding the psychological factors influencing price movements. A comprehensive study would require a robust dataset that tracks both social media sentiment and Bitcoin price data across various consolidation periods. Such a study could establish quantitative relationships between different sentiment levels and the corresponding price action.
A table illustrating this correlation would be helpful, but constructing it requires collecting and processing a large dataset.
| Social Media Sentiment | Bitcoin Price Action (during Consolidation) |
|---|---|
| Positive (high volume, bullish tweets) | Price increase or acceleration out of consolidation |
| Neutral (mixed sentiment, less volume) | Continued consolidation, but with minimal price changes |
| Negative (high volume, bearish tweets) | Prolonged consolidation, price decline or deceleration |
Potential Scenarios for Bitcoin Consolidation
The current Bitcoin consolidation phase presents a range of possible outcomes, making it crucial to analyze various scenarios and their implications. Understanding the potential trajectories allows investors to better prepare for different market responses and adjust their strategies accordingly. This analysis delves into possible durations, price movements, and factors influencing the consolidation’s resolution.The prolonged consolidation period underscores the complexity of predicting short-term price movements.
Numerous factors contribute to the unpredictability, including market sentiment, regulatory developments, and technological advancements. This analysis aims to provide a framework for understanding potential scenarios, recognizing that precise predictions are inherently challenging.
Possible Durations of the Consolidation
Understanding the potential duration of the consolidation is essential for investors. A prolonged consolidation phase can create uncertainty and affect investment decisions. Factors influencing the duration include investor sentiment, market volatility, and overall economic conditions. Historical data reveals that consolidation periods can vary significantly in length, from several weeks to several months.
- Short-term consolidation (2-4 months): Bitcoin might experience a quick rebound, driven by positive market sentiment or an unexpected catalyst. This scenario is likely if the consolidation is primarily driven by profit-taking after a significant bull run. Examples include periods where Bitcoin experiences short-lived but significant price corrections followed by rapid recovery.
- Medium-term consolidation (4-8 months): This scenario suggests that the market needs more time to evaluate the underlying value proposition of Bitcoin. Economic or regulatory uncertainty could prolong the consolidation. Consider historical examples of extended periods of sideways trading in other markets, where gradual but sustained growth eventually occurred after a long period of sideways movement.
- Long-term consolidation (8+ months): This is the most uncertain scenario, suggesting significant market uncertainty or substantial shifts in investor sentiment. This phase could be influenced by major global events or regulatory changes. Historical precedents, like prolonged periods of stagnation in the stock market due to major economic shifts, provide a context for considering this potential outcome.
Price Movement Outcomes Following Consolidation
Analyzing potential price movements following consolidation is crucial for investment strategy. The outcome can vary significantly depending on the factors influencing the consolidation.
- Significant upward breakout: Positive catalysts, like strong adoption by institutional investors or significant technological advancements, could lead to a substantial price increase. This is exemplified by past Bitcoin price rallies, which often followed periods of consolidation.
- Moderate upward trend: Continued gradual growth and positive investor sentiment might result in a more moderate price increase. This is a possibility if Bitcoin’s adoption continues to grow steadily.
- Sideways movement or further decline: Continued uncertainty or negative market sentiment could lead to a prolonged sideways movement or a further price decline. This is a possibility if significant bearish signals appear, or if institutional adoption doesn’t materialize as anticipated.
Factors Accelerating or Decelerating the Exit from Consolidation
Identifying factors that can accelerate or decelerate the exit from consolidation is critical. These factors can significantly impact the overall price trajectory.
- Accelerating factors: Strong institutional adoption, positive regulatory news, or significant technological advancements could accelerate the exit. Examples include significant institutional investment announcements or major partnerships.
- Decelerating factors: Economic uncertainty, negative regulatory developments, or a lack of positive catalysts could prolong the consolidation. Consider historical examples of market downturns caused by unexpected economic factors.
Potential Scenarios and Price Targets
The following table Artikels potential scenarios and their corresponding price targets. These targets are estimations based on current market conditions and historical trends.
| Scenario | Duration | Price Target (USD) | Key Factors |
|---|---|---|---|
| Short-term breakout | 2-4 months | $35,000 – $40,000 | Strong institutional adoption, positive regulatory news |
| Medium-term upward trend | 4-8 months | $30,000 – $35,000 | Continued adoption, steady market growth |
| Prolonged sideways movement | 8+ months | $25,000 – $30,000 | Economic uncertainty, lack of positive catalysts |
Final Summary

In conclusion, predicting the precise duration of Bitcoin’s consolidation is challenging, but analyzing historical patterns, technical indicators, and market sentiment provides valuable clues. Various factors, from investor psychology to regulatory changes, can influence the length of this consolidation. While no crystal ball can predict the future, understanding the dynamics at play allows for a more informed approach to navigating this market phase.
The potential scenarios Artikeld highlight the complexities of this market period, urging careful consideration before making any investment decisions.