Decoding Crypto with Elliott Wave Theory
What is Elliott Wave Theory and how to use it in crypto? This guide dives deep into the fascinating world of technical analysis, exploring how Elliott Wave Theory can help you navigate the often-turbulent crypto markets. We’ll uncover the fundamental principles of this powerful method, showing how it can be applied to spot patterns and potentially predict future price movements in the digital asset space.
From understanding the basic building blocks of impulse and corrective waves to applying the theory to real-world crypto scenarios, we’ll provide a comprehensive roadmap. We’ll also discuss common pitfalls, limitations, and advanced strategies for maximizing your potential in the volatile crypto landscape.
Introduction to Elliott Wave Theory
Elliott Wave Principle posits that market movements, including in cryptocurrencies, follow predictable patterns. These patterns are based on the idea that human psychology drives market behavior, creating recurring wave formations. Understanding these waves allows traders to anticipate potential price movements and make more informed decisions.The fundamental concept behind Elliott Wave Theory is the recurring nature of these wave formations, driven by collective investor sentiment.
The repetitive patterns are observed in various asset classes, from stocks to cryptocurrencies. This predictable behavior, while not foolproof, offers traders a framework for analysis and potential opportunities.
Wave Patterns: Impulse and Corrective
Wave patterns are the building blocks of Elliott Wave analysis. They are categorized into two primary types: impulse and corrective. Impulse waves are typically associated with strong market trends, while corrective waves represent periods of consolidation or reversal. Understanding the distinctions between these two types is critical for identifying potential turning points.
Impulse Waves
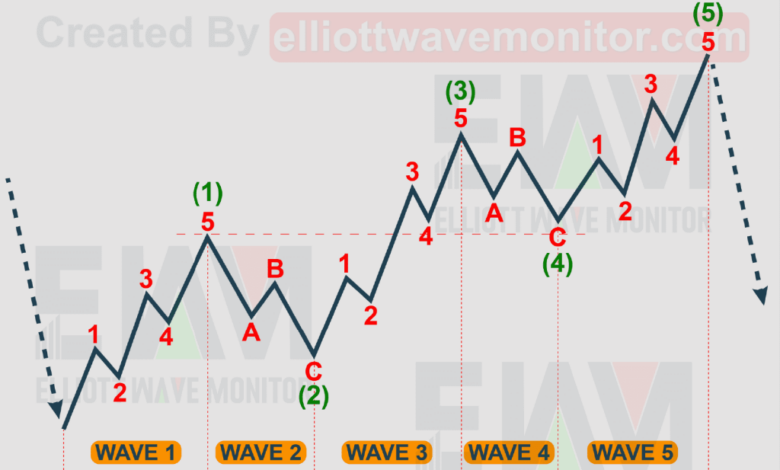
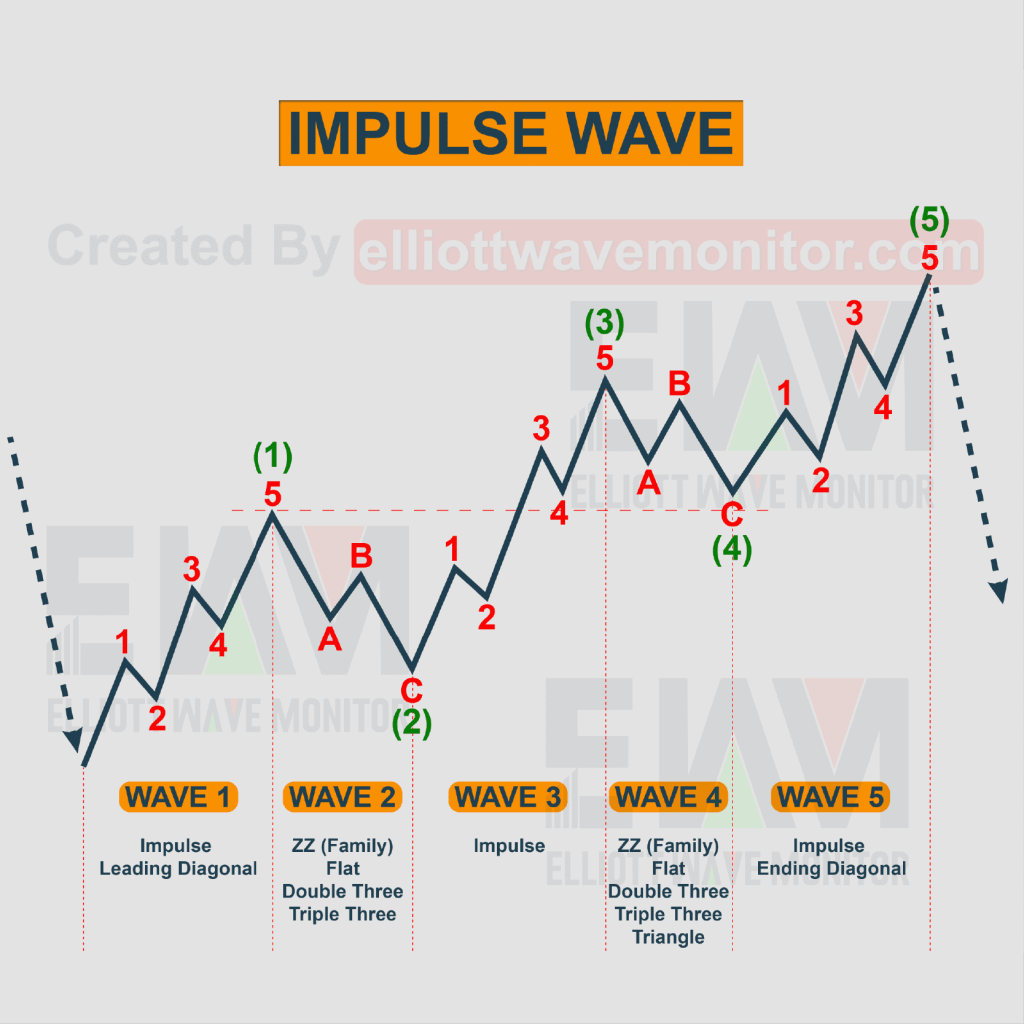
Impulse waves are characterized by a sequence of five waves. These five waves are generally in the direction of the prevailing trend. They represent the momentum phase of the market. The first three waves are typically impulsive and in the same direction, while the fourth wave is a corrective move against the trend, and the fifth wave is a continuation of the initial trend.
This pattern helps traders anticipate continuation and potential strength in a trend.
Corrective Waves
Corrective waves are characterized by three or more waves, usually in the opposite direction of the prevailing trend. They represent a period of consolidation, retracement, or reversal. These waves are designed to correct the price from the prior impulse movement. Identifying corrective patterns is crucial for understanding potential turning points and recognizing areas of support or resistance.
Basic Building Blocks of Wave Structures
Understanding the fundamental building blocks of wave structures is vital for successful application of Elliott Wave Theory. The primary building blocks are:
- Impulse Waves: These are characterized by five waves moving in the direction of the prevailing trend. Each wave can be further subdivided into smaller waves, but the overarching five-wave structure remains fundamental.
- Corrective Waves: These waves are designed to correct the price from the prior impulse movement. Corrective waves are generally made up of three or more waves, and they can take various forms, such as zigzags, triangles, and flat patterns. Recognizing these forms is essential to understanding the underlying market behavior.
Typical Wave Patterns
The following table illustrates the typical wave patterns, categorizing them as impulse or corrective, along with example labels.
| Wave Type | Wave Pattern | Example Labels |
|---|---|---|
| Impulse | 5 waves in the direction of the trend | 1, 2, 3, 4, 5 |
| Corrective | 3 or more waves against the trend | A, B, C; Zigzag; Flat; Triangle |
Understanding Wave Patterns in Crypto

Elliott Wave Theory, when applied to the crypto market, helps decipher the underlying patterns of price movements. By identifying these patterns, traders can potentially anticipate future price trends and make more informed decisions. Recognizing both impulse and corrective waves is crucial to understanding these patterns. Impulse waves drive the main trend, while corrective waves represent periods of consolidation or retracement.
Impulse Waves in Crypto
Impulse waves are the primary directional movements in a market trend. They are characterized by five waves, with the first, third, and fifth waves extending in the direction of the main trend. The second and fourth waves are corrective, smaller movements in the opposite direction. Impulse waves typically have a clear and distinct pattern, although the exact shape and duration can vary based on the specific market context.
Elliott Wave Theory, essentially, is a way to predict market movements by identifying patterns in price action. Applying it to crypto involves recognizing these patterns and using them to anticipate potential highs and lows. This is all pretty fascinating, but with Michigan becoming the latest state to propose a crypto reserve bill, this development might impact the future price action in crypto.
Understanding the underlying patterns through Elliott Wave Theory could be a key factor in navigating the potential volatility in the crypto market. It’s a complex strategy, but it could prove useful for crypto traders.
- The first wave (1) is the initial move in the direction of the larger trend.
- The second wave (2) is a corrective movement, often aiming to pull back from the initial move. It usually targets a level below the first wave’s start point. The extent of the pullback varies based on the intensity of the underlying trend. It can be a small or significant retracement.
- The third wave (3) is the most significant and powerful move in the direction of the trend. It often extends further than the first wave, demonstrating the strength of the underlying trend. It usually exceeds the length of the first and second waves combined.
- The fourth wave (4) is a minor corrective wave, opposing the direction of the third wave. It usually aims for a level above the beginning of the second wave. The fourth wave is typically less powerful than the second wave, serving as a smaller retracement.
- The fifth wave (5) completes the impulse structure, continuing in the direction of the larger trend. Often, the fifth wave targets a level that is either in line with or slightly beyond the target of the third wave.
Corrective Waves in Crypto
Corrective waves, in contrast to impulse waves, are meant to counteract the main trend’s direction. They are usually smaller in magnitude and often have three waves, sometimes with a subtle fourth wave within them. These waves can take on various forms.
Elliott Wave Theory helps predict crypto price movements by identifying patterns. It’s a fascinating tool, but understanding and applying it correctly is key. For example, the recent news of Velora being integrated into ParaSwap, as detailed in velora is now para swap introduces , could be a significant event impacting the crypto market and worth examining through an Elliott Wave lens.
Ultimately, recognizing these patterns is crucial for making informed trading decisions in the ever-evolving crypto landscape.
- Zigzags: Zigzag patterns consist of three waves, where the first wave (a) is in the direction of the main trend, the second wave (b) is corrective, and the third wave (c) completes the pattern in the same direction as the first wave. They are common corrective patterns.
- Triangles: Triangles are characterized by converging or diverging lines that create a symmetrical or asymmetrical shape. They indicate a period of consolidation before the next directional move. The trend may continue or reverse after a triangle.
- Wedges: Similar to triangles, wedges have converging or diverging lines but have a more slanted pattern, often hinting at a possible trend reversal.
- Double Zigzag: A double zigzag comprises two separate zigzag patterns, which are similar in structure and size. The pattern usually precedes a continuation of the previous trend.
- Triple Zigzag: A triple zigzag pattern is a more complex corrective structure, consisting of three zigzag patterns. The pattern signifies a significant period of consolidation and uncertainty, potentially signaling a reversal or a continuation of the previous trend.
5-Wave Impulse and 3-Wave Corrective Patterns
Identifying these wave patterns allows traders to potentially predict future price movements.
Examples of Impulse and Corrective Wave Structures
| Wave Structure | Description |
|---|---|
| Impulse (5-Wave) | A primary directional move consisting of five waves, with 1, 3, and 5 in the main trend direction and 2 and 4 corrective. |
| Corrective (3-Wave Zigzag) | A three-wave corrective pattern (a, b, c) where a moves in the main trend direction, b corrects against the trend, and c completes the pattern in the same direction as a. |
| Corrective (Double Zigzag) | Two consecutive zigzag patterns that consolidate before the next directional move. |
Applying Elliott Wave Theory to Crypto Trading
Elliott Wave Theory, while a valuable tool for analyzing market trends, isn’t a crystal ball. It’s a framework for interpreting price movements, recognizing patterns, and potentially anticipating future price actions, but it doesn’t guarantee success. Understanding its application in the volatile crypto market requires careful analysis and a healthy dose of skepticism. This section will explore practical methods for applying the theory to crypto trading.Identifying wave patterns in crypto charts requires a keen eye and a good understanding of the theory’s principles.
Elliott Wave Theory, basically, is a way to predict market movements by identifying patterns in price action. Using it in crypto means looking for repeating wave formations, like upward trends and corrections, to potentially spot buy and sell opportunities. Interestingly, with former congressman mchenry joining a16z senior adviser ( former congressman mchenry joining a16z senior adviser ), the influence of political and economic factors on crypto markets becomes even more significant.
This, in turn, could influence how investors apply Elliott Wave Theory to their trading strategies in the volatile crypto space.
Crucially, the patterns aren’t always immediately apparent, demanding careful scrutiny of chart formations. Recognizing impulse and corrective patterns is vital for determining the current market phase and potential future directions. By identifying these patterns, traders can potentially anticipate potential price reversals and capitalize on opportunities.
Identifying Wave Patterns in Crypto Charts
Recognizing the specific wave formations is a critical initial step. Impulse waves are characterized by five waves moving in the same direction, separated by three corrective waves. The most common corrective patterns are triangles, zigzags, and flat patterns. These patterns form in response to market fluctuations and represent the market’s attempt to consolidate or adjust before continuing in a particular direction.
Understanding the specific formations and the relationship between impulse and corrective patterns is crucial to successful application of the theory. Visual recognition is important; studying charts is crucial for gaining familiarity with these patterns.
Determining Wave Counts
Accurate wave counts are essential for making informed trading decisions. This involves correctly identifying the waves and accurately determining their respective lengths and phases. Counting waves requires patience and meticulous observation. A mistake in wave count can significantly misinterpret the market’s current momentum and lead to poor trading decisions. Using various tools and techniques can enhance accuracy in wave counting.
Using Fibonacci Retracement Levels with Wave Patterns
Fibonacci retracement levels can enhance the accuracy of Elliott Wave analysis. These levels are based on mathematical proportions that often coincide with significant support and resistance areas on price charts. Combining Fibonacci levels with identified wave patterns can help determine potential entry and exit points. The levels can act as crucial markers in identifying likely areas of support and resistance.
Application in a Crypto Market Scenario
Consider Bitcoin’s price action during a recent bull market. After a significant price surge (impulse wave), the price experienced a period of consolidation (corrective wave), creating a pullback in a specific pattern. Recognizing this corrective pattern allowed traders to identify potential entry points as the price approached support levels. The subsequent breakout from the corrective pattern signaled the continuation of the upward trend.
By correctly identifying the waves and their patterns, traders can increase their likelihood of making accurate predictions about the future price movements.
Steps for Analyzing Crypto Charts Using Elliott Wave Theory
| Step | Action | Explanation |
|---|---|---|
| 1 | Identify the overall trend (uptrend, downtrend, or consolidation). | Establishing the prevailing trend is the foundation for Elliott Wave analysis. |
| 2 | Identify the dominant wave pattern (impulse or corrective). | Determine whether the market is in a phase of movement or consolidation. |
| 3 | Determine the wave count. | Accurately count the waves to ascertain the current phase of the market. |
| 4 | Apply Fibonacci retracement levels. | Identify potential support and resistance levels to gauge the price action. |
| 5 | Identify key support and resistance levels. | Identify areas where the price might find support or resistance. |
| 6 | Analyze the potential for continuation or reversal. | Predict the possible future price movement based on the current wave pattern. |
Common Challenges and Pitfalls
Applying Elliott Wave Theory to the volatile crypto market presents unique challenges. While the theory can offer insightful patterns, its application requires a deep understanding of the potential pitfalls. Naive application can lead to costly mistakes, particularly in the fast-paced and unpredictable nature of crypto trading. Understanding these common pitfalls is crucial for effective use of the theory in the crypto space.
Subjectivity in Wave Identification
Elliott Wave Theory relies on identifying patterns within price movements. However, determining the precise wave count and boundaries is inherently subjective. Different analysts can interpret the same price action differently, leading to conflicting wave counts and predictions. This subjectivity can be exacerbated by the often-ambiguous nature of crypto market movements, making it difficult to establish clear, unambiguous wave structures.
Market Noise and False Signals
Crypto markets are notoriously noisy. Short-term fluctuations and market sentiment can create false signals that mimic Elliott Wave patterns. Traders must possess a strong understanding of the underlying market dynamics to filter out noise and focus on meaningful trends. Overlooking these external factors, such as sudden price spikes, can lead to misinterpreted wave patterns and subsequently, poor trading decisions.
Confirmation and Validation
Successful application of Elliott Wave Theory demands robust confirmation and validation of wave counts. Simply identifying patterns is insufficient. Traders must incorporate additional technical analysis tools and indicators to validate their interpretations. Without proper validation, the subjective nature of wave identification can lead to incorrect predictions and unprofitable trades.
Timeframe Considerations
The Elliott Wave principle operates across various timeframes. Focusing solely on a specific timeframe, neglecting others, can lead to inaccurate interpretations. A wave pattern observed on a daily chart might not align with the longer-term trend on a weekly or monthly chart. Therefore, a holistic view across multiple timeframes is essential for successful application.
Emotional Trading
Elliott Wave analysis, like other technical analysis tools, is not a foolproof method for predicting the future. Emotional trading, driven by fear and greed, can lead to poor decision-making, irrespective of the analysis. Traders should approach Elliott Wave Theory as a tool to aid in decision-making, but not as a guarantee of success. The importance of emotional control in trading is a critical aspect that must be considered when using any trading method.
Common Pitfalls and Avoidance Strategies
- Subjectivity in Wave Identification: Utilize multiple sources and diverse perspectives. Employing advanced charting software and tools, along with consulting experienced traders, can reduce the impact of personal biases.
- Market Noise and False Signals: Prioritize longer-term trends. Develop a robust risk management strategy that considers market volatility.
- Confirmation and Validation: Employ a combination of technical indicators (e.g., moving averages, RSI) to validate the identified wave counts.
- Timeframe Considerations: Analyze price action across various timeframes (daily, weekly, monthly) to ensure alignment with longer-term trends.
- Emotional Trading: Maintain a disciplined trading plan, and stick to predetermined entry and exit points. Utilize stop-loss orders to limit potential losses.
Limitations of Elliott Wave Theory in Crypto: What Is Elliott Wave Theory And How To Use It In Crypto
Elliott Wave Theory, while a valuable tool for analyzing market trends in established asset classes like stocks and commodities, faces unique challenges when applied to the volatile and nascent cryptocurrency market. Its inherent reliance on discernible patterns can be undermined by the unpredictable nature of cryptocurrencies, influenced by factors like regulatory changes, technological advancements, and social media trends. Understanding these limitations is crucial for traders seeking to effectively integrate the theory into their crypto strategies.The crypto market operates under a different set of dynamics compared to traditional markets.
High volatility, rapid price fluctuations, and the constant emergence of new technologies and projects often disrupt the predictable wave patterns identified by the theory. Speculative bubbles, pump-and-dump schemes, and sudden shifts in investor sentiment are frequent occurrences in the crypto space, making it difficult to apply Elliott Wave principles with consistent accuracy.
The Impact of Crypto’s Unique Characteristics
The inherent volatility of cryptocurrencies, coupled with the lack of established historical data compared to traditional markets, presents a significant hurdle for Elliott Wave analysis. The rapid pace of innovation and the relatively short history of many cryptocurrencies make it challenging to identify and extrapolate meaningful wave patterns. The unpredictable nature of regulatory developments, social media hype cycles, and technological advancements further complicates the application of the theory.
Difficulties in Identifying Wave Patterns
Crypto markets are often characterized by impulsive movements, rapid corrections, and overlapping wave structures. These factors can make it difficult to definitively identify the wave count and direction. The presence of numerous overlapping trends and unpredictable price actions often hinders the identification of clear wave patterns. The lack of established support and resistance levels, common in traditional markets, further complicates the application of Elliott Wave analysis.
Predictive Accuracy and Market Behavior
While Elliott Wave Theory can offer insights into potential market movements, its predictive accuracy in the crypto market is often limited. External factors, including regulatory uncertainty, technological breakthroughs, and social media sentiment, can significantly impact market behavior and invalidate predicted patterns. The theory, based on historical market data, may not fully capture the unique dynamic of the crypto space, which is characterized by continuous innovation and rapidly evolving market structures.
Comparison Across Asset Classes
| Asset Class | Strengths of Elliott Wave Theory | Limitations in Crypto |
|---|---|---|
| Stocks | Relatively established historical data, identifiable trends, and recognizable patterns. | Less susceptible to the disruptive influences of technological advancements and regulatory changes. |
| Commodities | Historically demonstrates identifiable trends, and patterns, although susceptible to external factors like supply and demand. | Less impacted by social media sentiment and rapid technological shifts than crypto. |
| Cryptocurrencies | Potential for identifying trends and patterns, but often less reliable due to market volatility and unpredictable factors. | High volatility, rapid price fluctuations, lack of established historical data, and unpredictable social and technological influences significantly impact the theory’s effectiveness. |
Advanced Applications and Strategies
Elliott Wave Theory, while providing a framework for understanding market movements, requires a nuanced approach for successful application in the dynamic crypto market. Beyond basic wave identification, advanced techniques involve combining the theory with other tools and adapting strategies to various timeframes and market conditions. Understanding these strategies is crucial for mitigating risk and maximizing potential returns.
Combining Elliott Wave with Other Technical Indicators
Successfully integrating Elliott Wave Theory with other technical indicators enhances the accuracy and reliability of analysis. This combined approach allows for a more comprehensive view of market trends. Combining Elliott Wave analysis with indicators like moving averages, RSI, and MACD provides a more complete picture of potential market reversals and confirms wave patterns. For instance, a bullish Elliott Wave pattern confirmed by a rising moving average and a rising RSI often suggests a stronger continuation of the uptrend.
Conversely, a bearish wave pattern accompanied by a falling moving average and declining RSI increases the probability of a price correction.
Managing Risk and Capital
Risk management is paramount when employing any trading strategy, especially in the volatile crypto market. Elliott Wave Theory, while helpful in identifying potential trends, does not guarantee outcomes. Implementing strict stop-loss orders, which automatically sell a position if the price falls below a certain level, is a crucial component of a robust risk management plan. This protects capital from significant losses.
Similarly, using position sizing strategies, such as determining a percentage of capital allocated to each trade, helps limit potential losses and ensures that no single trade overwhelms the overall trading capital. For instance, if a trader allocates 2% of their capital to a single trade, a 10% loss on that trade will only affect 0.2% of their total capital.
Adapting Wave Pattern Identification to Different Timeframes
Elliott Wave Theory is applicable across various timeframes, from intraday charts to yearly charts. Identifying patterns on different timeframes provides a broader perspective on the overall trend. For example, a long-term bullish trend on a yearly chart may be supported by shorter-term bullish waves on weekly or daily charts. Conversely, a short-term correction within a larger uptrend is often a part of a larger wave pattern.
Recognizing the interplay of wave patterns across different timeframes is essential for accurately interpreting the market’s directional bias. Using multiple timeframes, from hourly to weekly, provides a comprehensive view of the current market condition, improving the reliability of the Elliott Wave analysis.
Illustrative Examples of Crypto Market Analysis
Elliott Wave Theory, while powerful, isn’t a crystal ball. Its predictive power relies heavily on identifying recognizable patterns in past price action. Analyzing historical data, particularly significant market events, helps refine our understanding of how the theory applies to current and future movements. This section delves into case studies, demonstrating how Elliott Wave Theory can be applied to explain and potentially predict price patterns in the crypto market.Analyzing crypto price movements through the lens of Elliott Waves provides insights into market psychology and potential future trends.
Identifying the wave structure within a particular price action helps in understanding the underlying market sentiment and momentum. Successful application requires a keen eye for detail and the ability to recognize the interplay of different wave patterns.
Case Study: Bitcoin’s 2021 Bull Run, What is elliott wave theory and how to use it in crypto
The 2021 Bitcoin bull run offers a compelling case study. Price surges were punctuated by periods of consolidation, mirroring the expected patterns within an impulsive wave. The initial rapid ascent, followed by corrective retracements, closely resembled an impulsive wave sequence, highlighting how the theory can track the bull run’s evolution.
- The initial surge (wave 1) was followed by a sharp decline (wave 2), a corrective retracement, creating a clear impulse structure. This was followed by another upward surge (wave 3), often the strongest of the three waves in an impulse sequence. Subsequent wave 4 retracements and wave 5 upward extensions are all typical components of a bullish impulse wave pattern, seen in many crypto assets during this period.
Analyzing the precise timeframes and amplitudes of each wave helps to establish whether the identified pattern is indeed an impulsive wave.
- Analyzing the specific details of the 2021 bull run allows for a deeper understanding of how Elliott Wave Theory can identify patterns that indicate potential continuation or reversal of the trend.
Hypothetical Scenario: Litecoin Price Movement
Imagine Litecoin’s price exhibiting a clear five-wave impulse structure followed by a three-wave corrective structure. The hypothetical scenario below illustrates how Elliott Wave Theory might interpret this.
| Wave Number | Direction | Description |
|---|---|---|
| 1 | Up | Initial impulsive move |
| 2 | Down | Corrective retracement |
| 3 | Up | Strong upward impulse wave |
| 4 | Down | Minor corrective retracement |
| 5 | Up | Final upward movement completing the impulse sequence |
| A | Down | Corrective retracement (Wave 1) |
| B | Up | Counter-trend movement |
| C | Down | Completing the corrective pattern |
The hypothetical scenario above showcases how wave structure, including impulse and corrective waves, can be utilized to interpret and forecast potential price movements in cryptocurrencies.
Deep Analysis of Ethereum’s 2018 Correction
Ethereum’s 2018 price correction provides another example. The correction’s intricate structure, composed of multiple waves, can be identified and analyzed.
- The downward trend, identified as a complex corrective pattern, shows a clear series of waves that might represent a larger, bearish corrective pattern.
- Identifying the wave structure in this complex correction helps in understanding the underlying market sentiment and momentum during that period.
- The correction involved multiple sub-waves, each with its own characteristics. Identifying these sub-waves is crucial for a comprehensive understanding of the correction. The 2018 correction is an excellent example of how Elliott Wave Theory can be used to analyze periods of price decline in the crypto market.
End of Discussion
In conclusion, Elliott Wave Theory offers a valuable framework for analyzing crypto market trends, providing insights into potential price movements. While not a foolproof predictor, it can be a helpful tool in conjunction with other strategies for navigating the complex world of cryptocurrency. By understanding its principles and limitations, and by applying the techniques Artikeld in this guide, you can potentially enhance your trading strategies in the dynamic crypto market.
Remember, thorough research and a balanced approach are key.